Get Involved
NCST’s work increases access to homeownership, promotes resilient neighborhoods, and advances racial equity by advocating for policy change.
Middle neighborhoods are a category of neighborhoods that are neither clearly healthy and thriving, nor overtly distressed. Millions of middle- and working-class families in cities and suburbs across the nation call middle neighborhoods home. But despite their prevalence, and the energy being poured into stabilizing and revitalizing these neighborhoods, there is not clear agreement on how to define middle neighborhoods. What, exactly, are middle neighborhoods, and what are they in the middle of? And how can we reliably identify middle neighborhoods in the communities where we live and work?
Efforts to assign a precise definition of middle neighborhoods have been fraught with debate. For example, are middle neighborhoods better defined based on the incomes of the households who live there, their home values, or regional neighborhood trends? Definitions based on income are the most applicable nationally, but Mallach (2018) has found that the city neighborhoods that are considered ‘middle’ are often quite different depending on whether one’s definition is based on citywide, regional, or national incomes. These differences are most stark in cities that are significantly poorer than their surrounding suburbs. Ultimately, he concludes that middle neighborhoods may not be susceptible to precise definition and that practitioners needs to use their judgment.
To shed light on how to define middle neighborhoods, the National Community Stabilization Trust has created a nationwide map that allows users to explore the communities where middle-income households live. The map allows users to select among seven different definitions of middle neighborhoods, each of which identifies middle neighborhood census tracts within metropolitan areas based on their median household incomes.
The seven definitions are:
It is important to put these income thresholds in context. A household with one earner making $12 an hour at a full-time job earns about $25,000 per year, or with two earners at this rate, about $50,000. A middle neighborhood in Buffalo, with a city-wide median income of about $55,400 in 2018, looks very different from a middle neighborhood in San Francisco, with a city-wide median of $99,500. We encourage users of the map to pay attention to differences between city, region, and national median incomes, and be deliberate in selecting lower-income (60-100%) or higher-income (80-120 or 100-160%) thresholds.
Because a critical consideration in identifying and understanding a middle neighborhood is its trajectory towards prosperity or decline, the map allows users to choose among layers examining both the 2014-2018 period and the 2006-2010 period.
This map is a starting point for understanding the breadth and location of middle neighborhoods in cities and suburbs across the country. The map analyses census tracts, which are large compared to many neighborhoods. Economic and social conditions can vary dramatically within a single census tract, even block by block. In addition, the map defines middle neighborhoods based on the incomes of their residents. Other practitioners have found other indicia of middle neighborhoods, such as local housing market conditions, more appropriate in their markets. Local practitioners should conduct their own analysis when identifying middle neighborhoods or strategies to improve them.
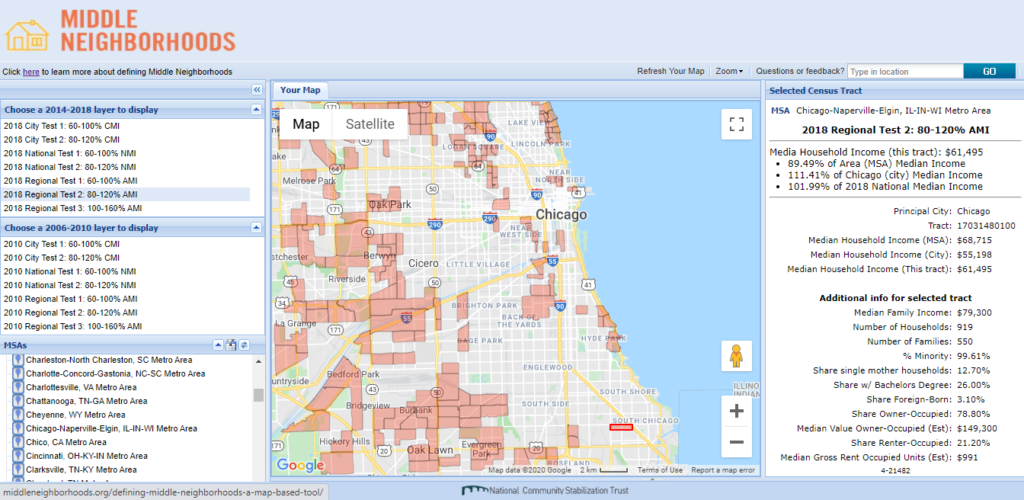
To use the map, first select the middle neighborhoods definition you wish to apply from either the 2018 or 2010 data list, then either select a Metropolitan Statistical Area or browse the map yourself by dragging it with your mouse and/or adjusting your zoom. If the map does not load automatically or is loading slowly, please click “Refresh your Map” in the area directly above the map. You can also view social and economic data about each middle neighborhood census tract by clicking directly on the tract outline within the map.
The National Community Stabilization Trust plans to update this map over time, including by incorporating data from earlier decades. If you have any suggestions, questions, or comments about the map, please reach out to [email protected]. The current map is the release version 1.0.
Data sources: All income, social, and economic data from 2014-2018 and 2006-2010 American Community Survey (5-year ACS) Estimates. Each census tract was assigned to an MSA using FHFA’s 2020 Low-Income Areas file. City-wide incomes are based on the MSA’s Principal City identified in Census Bureau’s March 2020 Principal Cities of Metropolitan and Micropolitan Statistical Areas file. It is important to note that ACS home price and rent data is respondent estimated.
For Media Inquiries:
Please reach out to the following NCST staff for comments on Middle Neighborhoods:
Marcia Nedland, Lead Organizer
To receive updates on middle neighborhood Community of Practice activities and general information about middle neighborhoods, please sign up here. By signing up, you will also receive the bi-monthly Community of Practice newsletter.
NCST’s work increases access to homeownership, promotes resilient neighborhoods, and advances racial equity by advocating for policy change.